Statistics
The Statistics page shows how your videos perform on your fan-facing frontpage — how many times they were watched, for how long, and on what kind of device. You can filter by time period and drill down by site, content type, and channel.
Availability
Statistics is only available for clubs and leagues that have a connected frontpage on the platform. If your organization does not have a frontpage connected, the Statistics option will not appear under the Other menu.
What you can see also depends on your role — regular users see viewing statistics for their own channel, while administrators can see figures across all channels.
If you expect Statistics but do not see it, please contact our Support Team.
1. Open the Statistics Page
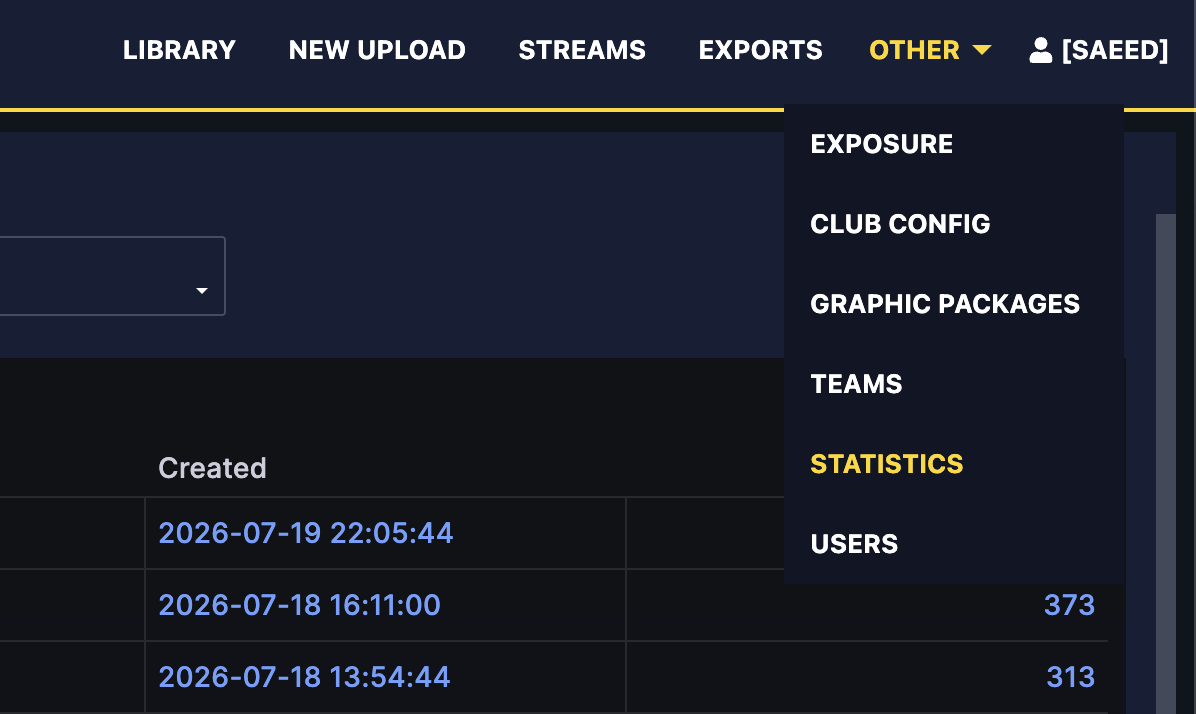
- In the top navigation bar, open the Other menu and click Statistics.
2. Choose What to Measure
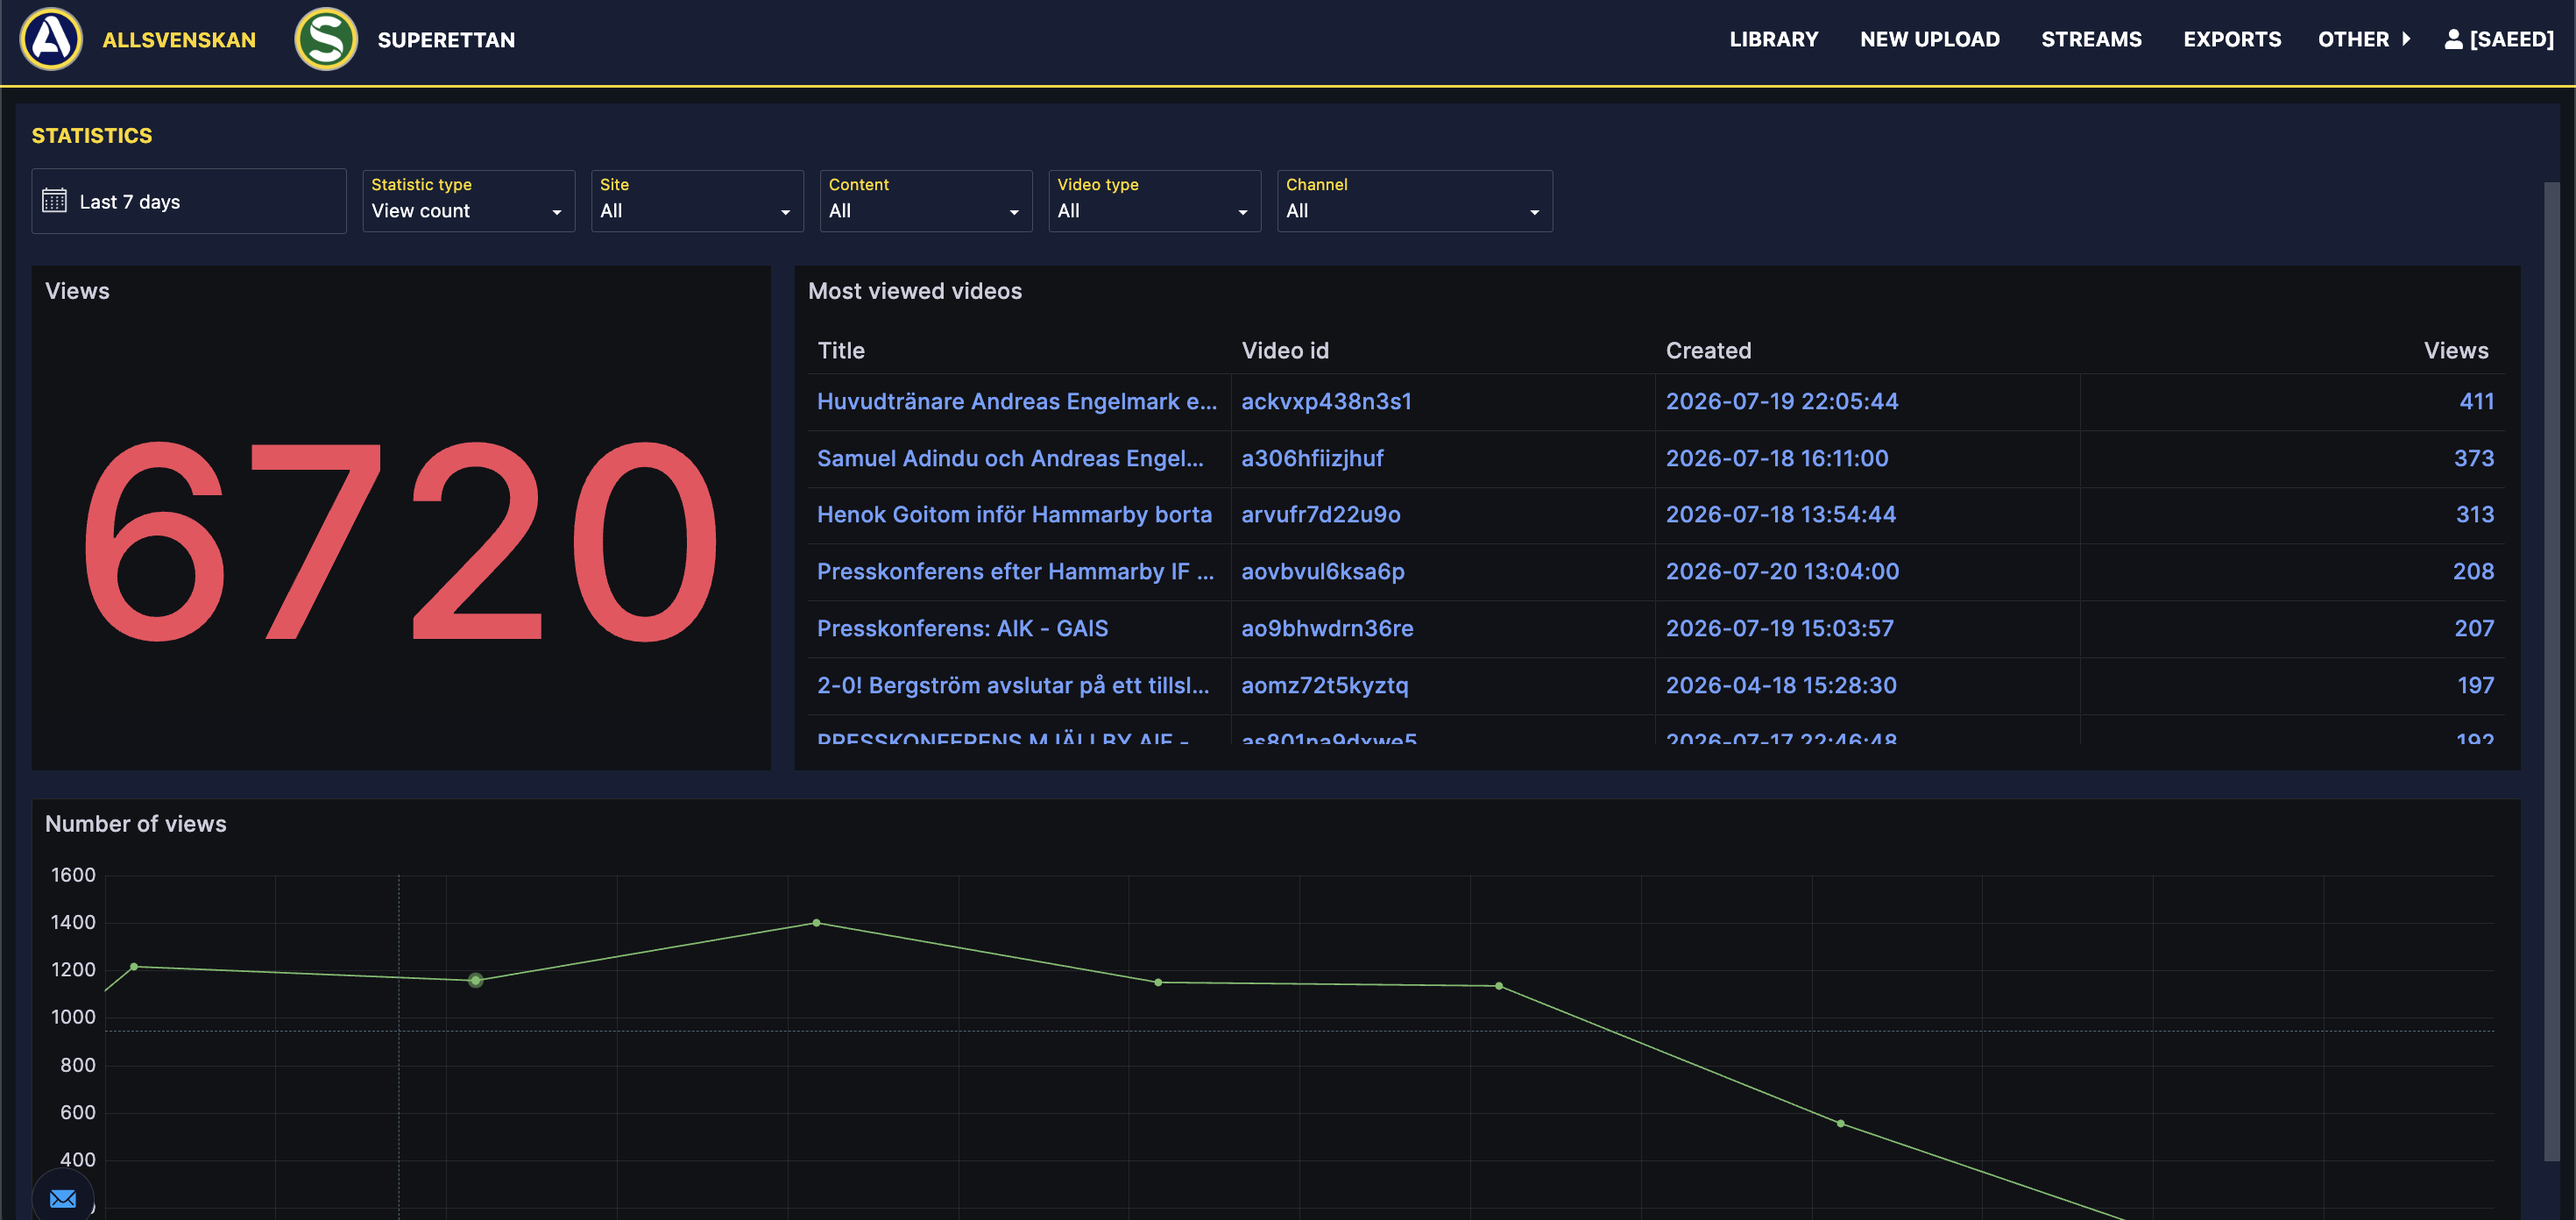
Two filters at the top control the whole page:
- Period — the time range to analyze: Today, Last 7 days, This month, Last month, This year, or Last year.
- Statistic type — which metric to show (see the next section).
3. Statistic Types
| Type | What it shows |
|---|---|
| View count | How many times videos were viewed on your frontpage |
| Duration | Total watch time (how long videos were watched) |
| Other | Device usage — the split between the devices viewers used |
| Social media | Performance of posts you shared to social media (see below) |
| Export record | A record of videos exported/downloaded from the MAM |
What you see depends on your role
Regular users see View count and Duration. Administrators additionally see Other, and platform administrators see Social media and Export record. The available options in the Statistic type filter adjust automatically.
For Social media analytics, see the dedicated guide: Social Media Analytics.
4. Refine the Numbers (View count & Duration)
When viewing View count or Duration, extra filters let you narrow down the results:
- Site — limit to a specific site, or All.
- Content — Official events, Club content, or All.
- Video type — Live, VoD (video on demand), or All.
- Channel — a specific channel, or All (administrators only).
5. Read the Results
For each metric the page shows three things together:
- A headline number — the total for the selected period and filters.
- A table — a breakdown of the figures.
- A graph — the trend over the selected period.
Whenever you change a filter, the figures refresh automatically.
Need Help?
If the numbers look unexpected or a statistic type is missing, please reach out to our Support Team.