Social Media Analytics
After sharing your videos to social media, you can follow how they perform without leaving the MAM. The Social Media Analytics view shows your accounts on YouTube, Instagram, and TikTok — total views, likes, and comments, performance charts, and a post-by-post breakdown.
Availability
Social Media Analytics is enabled per organization and requires that your social media accounts are connected to the platform. If you do not see the Social media option on the Statistics page, please contact our Support Team.
Steps to View Your Analytics
1. Open the Statistics Page
- Go to the top navigation bar and click Other → Statistics.
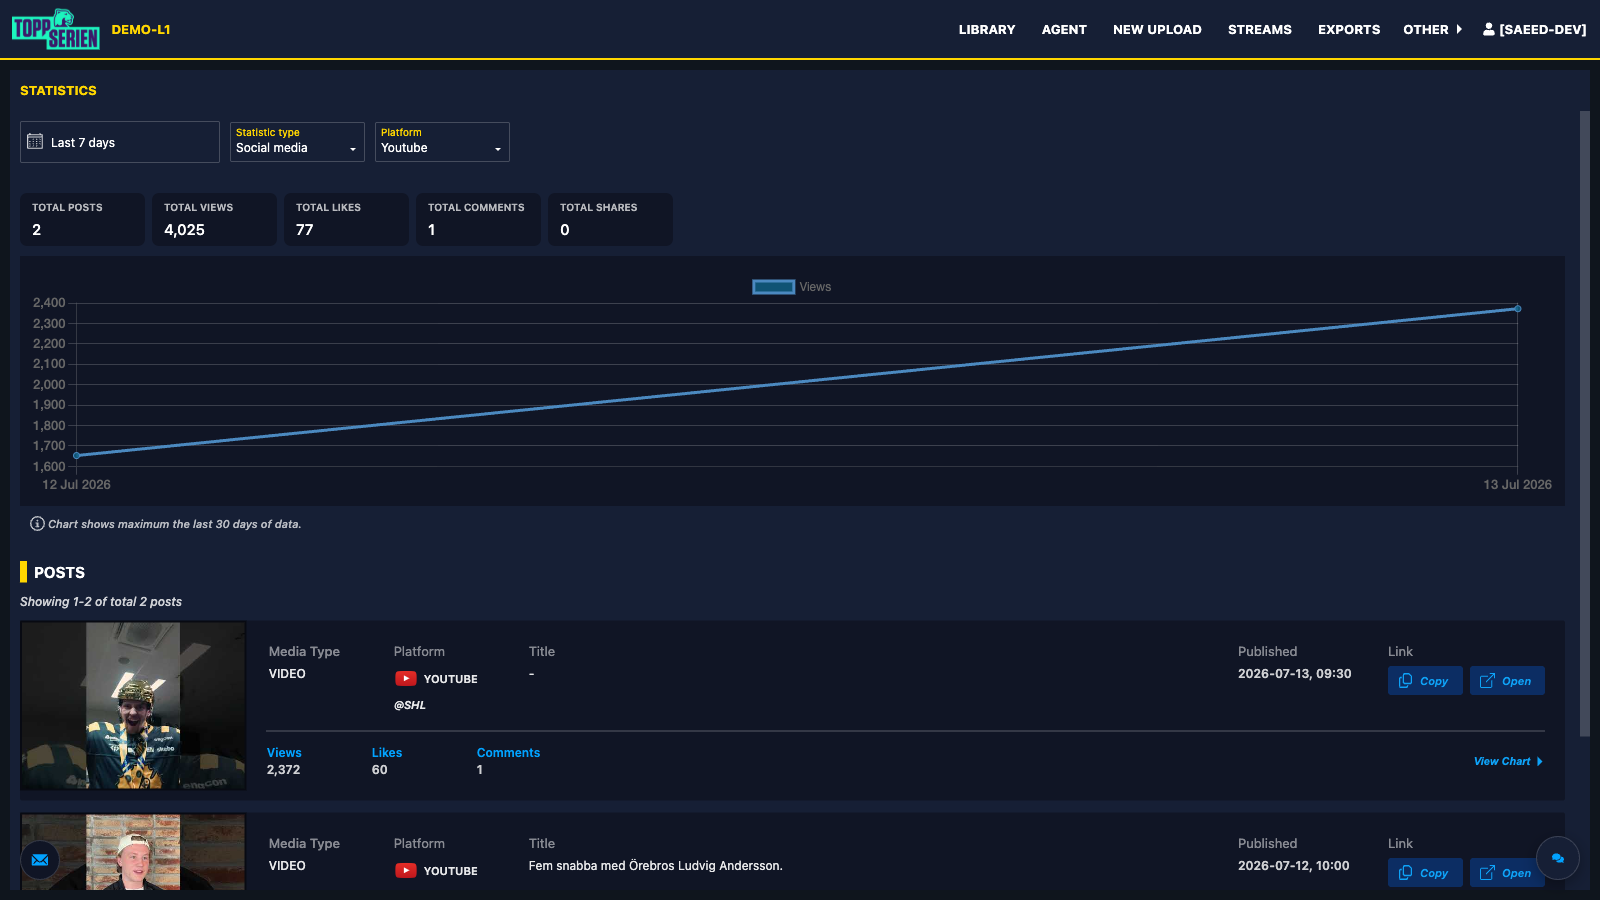
- In the Statistic type filter, select Social media.
2. Choose a Platform and Time Period
Two filters at the top of the page control what you see:
- Platform: Switch between YouTube, Instagram, and TikTok. The page shows the account connected for your organization on the selected platform.
- Period: Choose the time range to analyze, for example Today, Last 7 days, or This month.
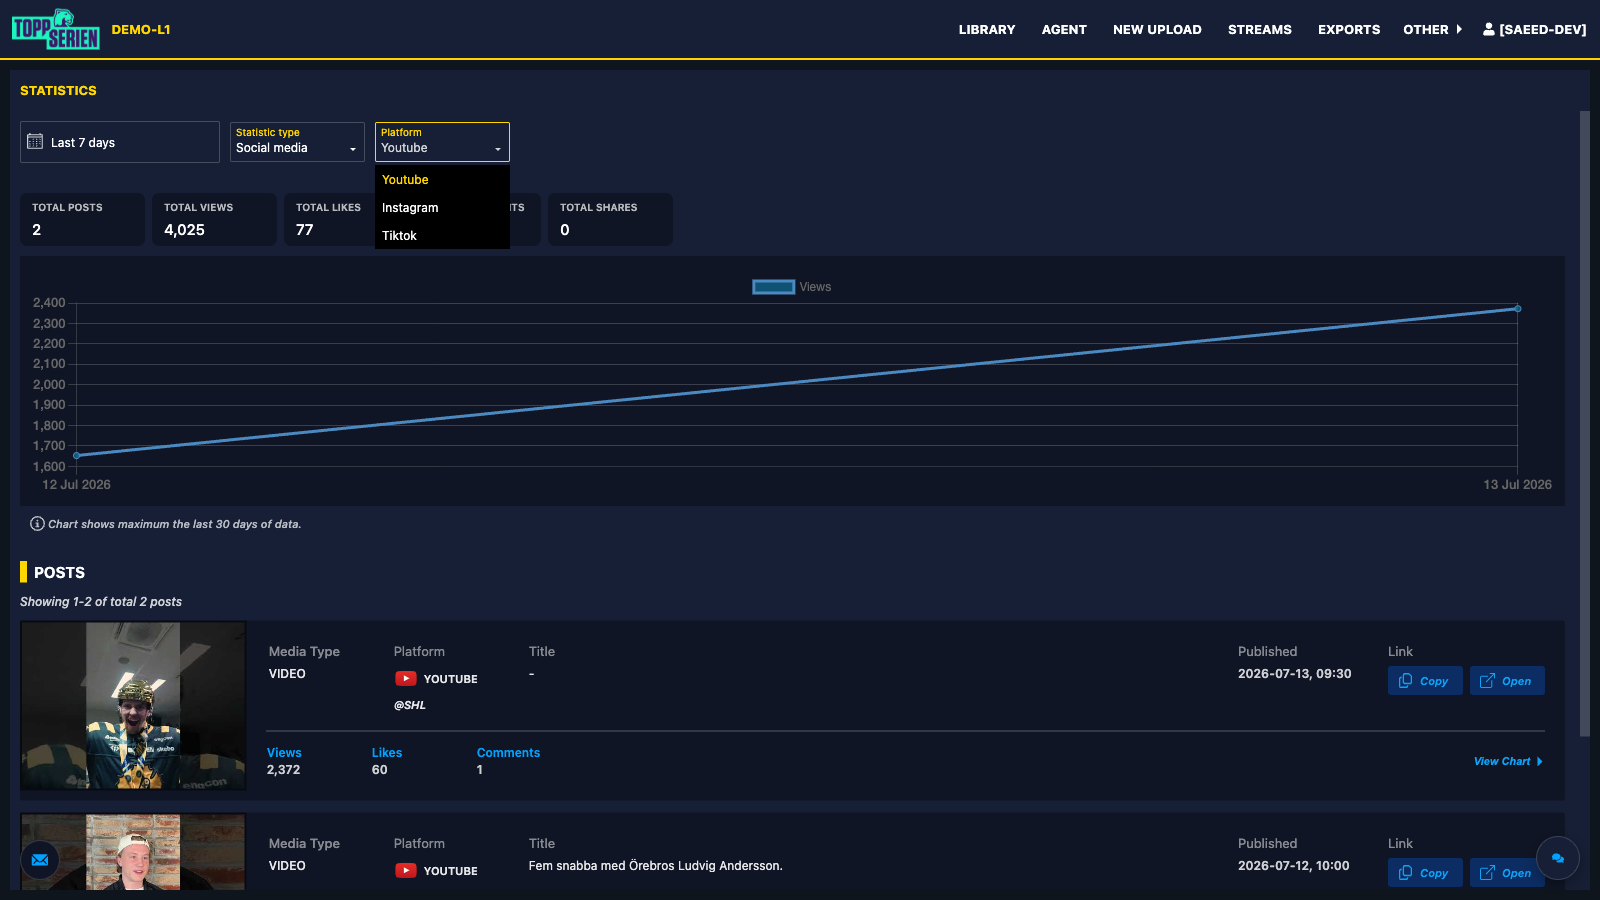
YouTube time range
For YouTube, analytics can go back a maximum of 90 days — this is a restriction from YouTube, not the MAM.
3. Read the Summary
The summary at the top shows the totals for the selected platform and period:
- Total Posts — how many posts were published.
- Total Views, Total Likes, Total Comments, and Total Shares — the combined engagement across those posts.
Next to the totals, a chart shows how the views developed over time. The chart displays at most the last 30 days of data.
4. Browse Your Posts
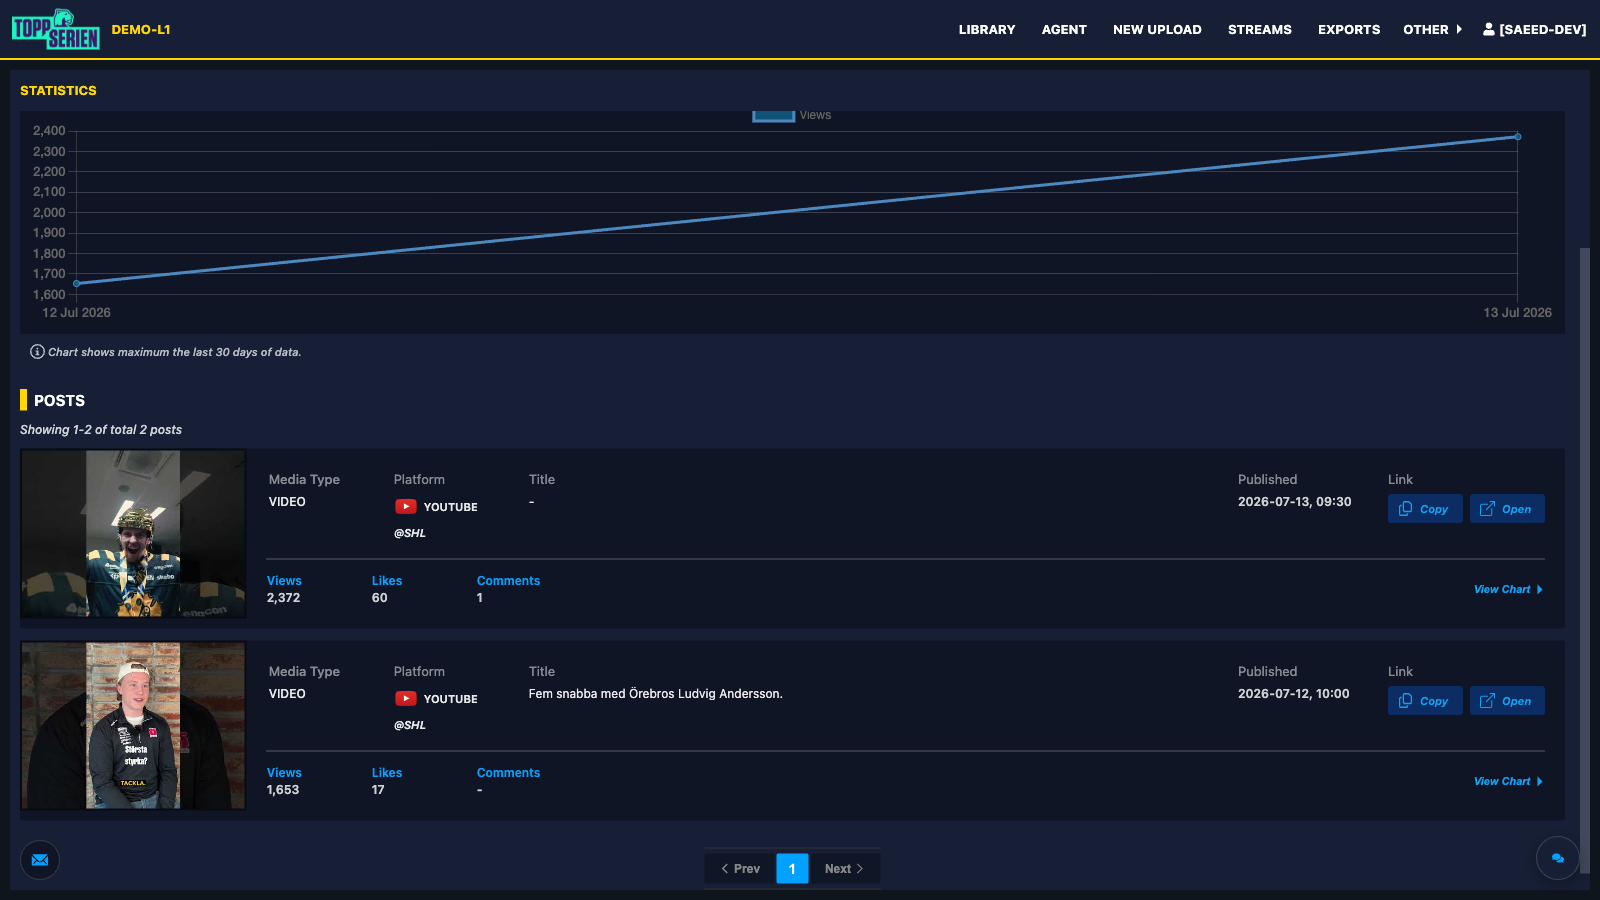
Below the summary, the Posts list shows each post published in the selected period, 10 posts per page. For every post you can see:
- The video thumbnail, title, and media type.
- The platform and account it was published on — click the account name to open the profile on the platform.
- The published date and time.
- Views, Likes, and Comments for that post.
- Link actions: click Copy to copy the post's link to your clipboard, or Open to view the post directly on the platform.
5. View a Post's Chart
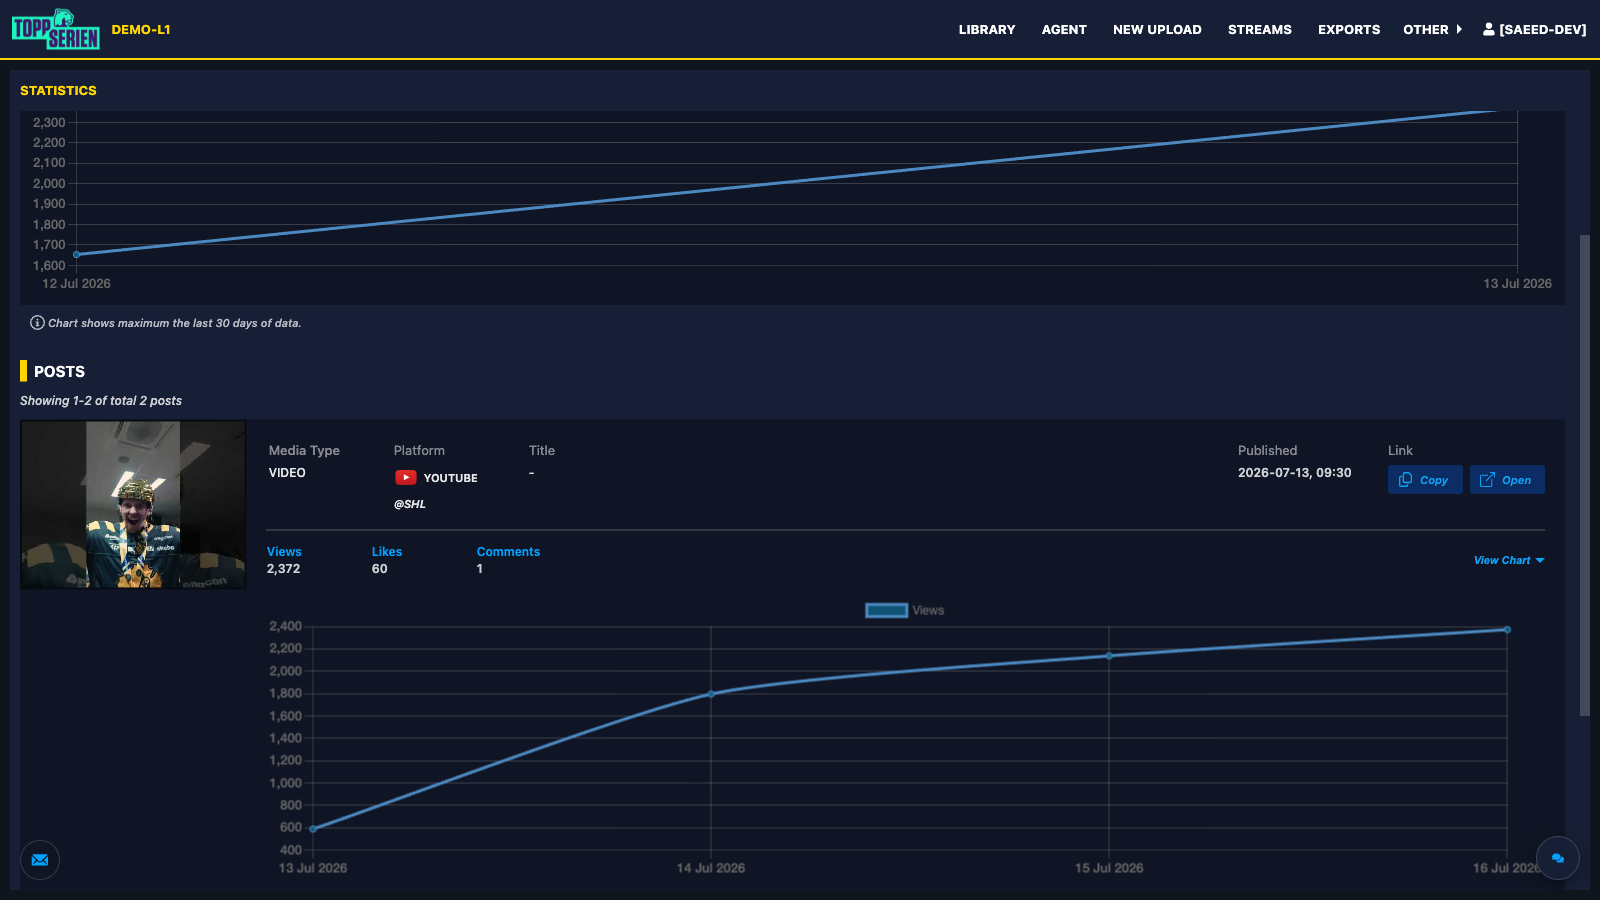
Click View Chart on any post to expand a chart showing how that post's metrics developed over time. Click it again to collapse the chart.
Ask the AI Agent
If the AI Agent is enabled for your organization, you can also ask it things like "Show the top performing social posts this week" — it summarizes the numbers for you and links straight to the post's analytics.
Need Help?
If you encounter any issues while using Social Media Analytics, don't hesitate to contact our Support Team for help.